
Glances
Glances reports on a machine. This shows CPU, memory, GPU, network and disks as tiles and cards, and the assistant can see the top programs.
Set it up
Section titled “Set it up”integrations: glances: type: glances url: http://glances:61208 network: eth0 cpuSensor: CPU disks: - mount: / name: System sub: NVMe - mount: /mnt/media name: Media - mount: /mnt/backup name: Backup
layout: - title: Infrastructure widgets: - glances.tiles| Option | Type | Default | What it does |
|---|---|---|---|
url | URL | required | Where the service answers, from Valet’s side. |
disks | list of string or object | optional | Mount points to show, every real disk by default. { mount, name, sub } labels a tile. |
network | string | optional | interface to show, e.g. “eth0” |
cpuSensor | string | CPU | label of the CPU temperature sensor |
Widgets
Section titled “Widgets”3 widgets. Each key starts with your instance name, here glances.
System
Section titled “System”glances.tiles · stats card · refreshes every 3 seconds while the page is open.

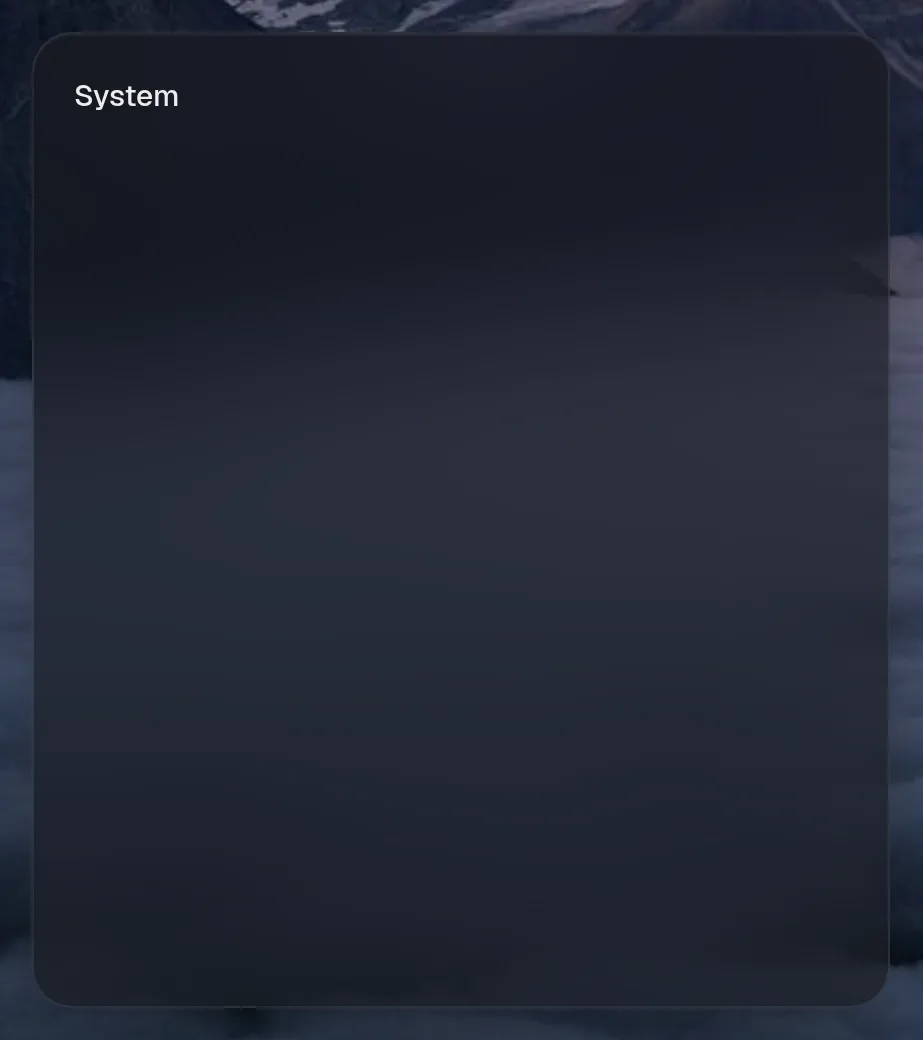


Small draws the same as medium. Wide draws the same as medium, so they aren't shown. Only the empty space changes.
States
Section titled “States”
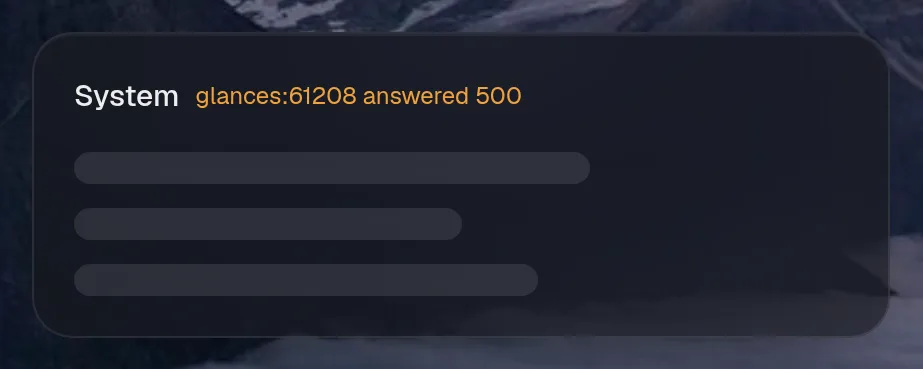
System
Section titled “System”glances.overview · stats card · refreshes every 5 seconds while the page is open.
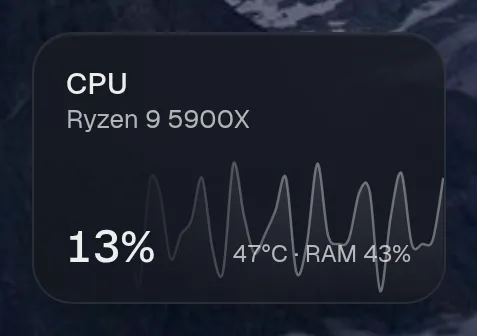
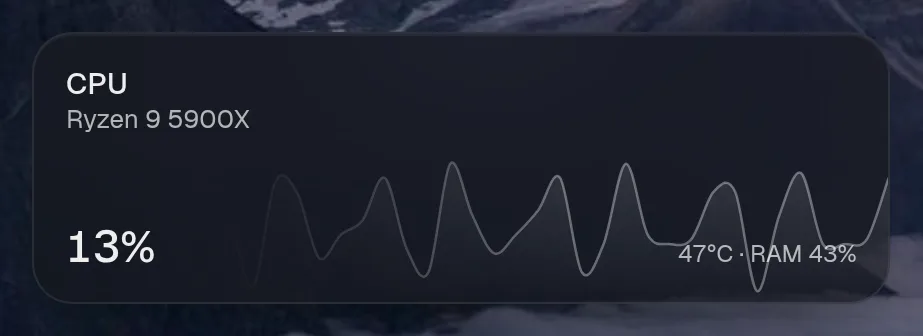
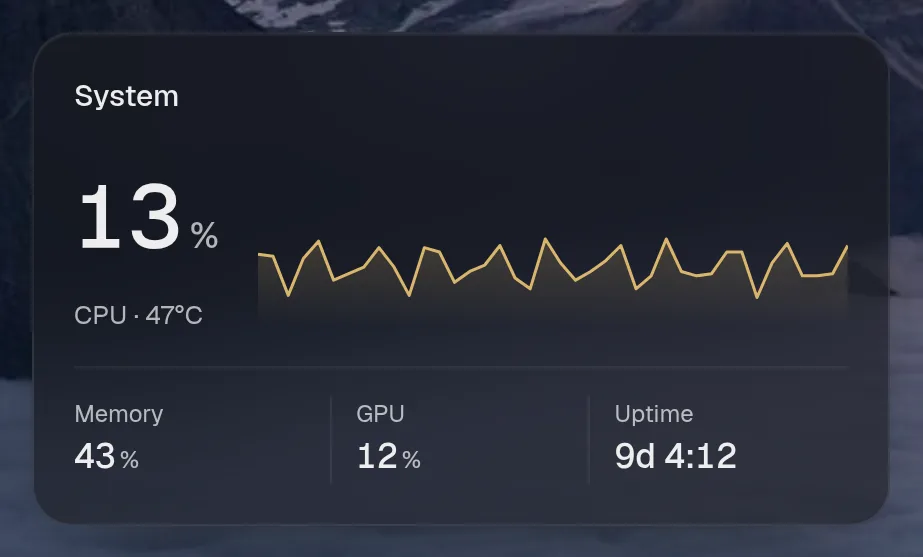
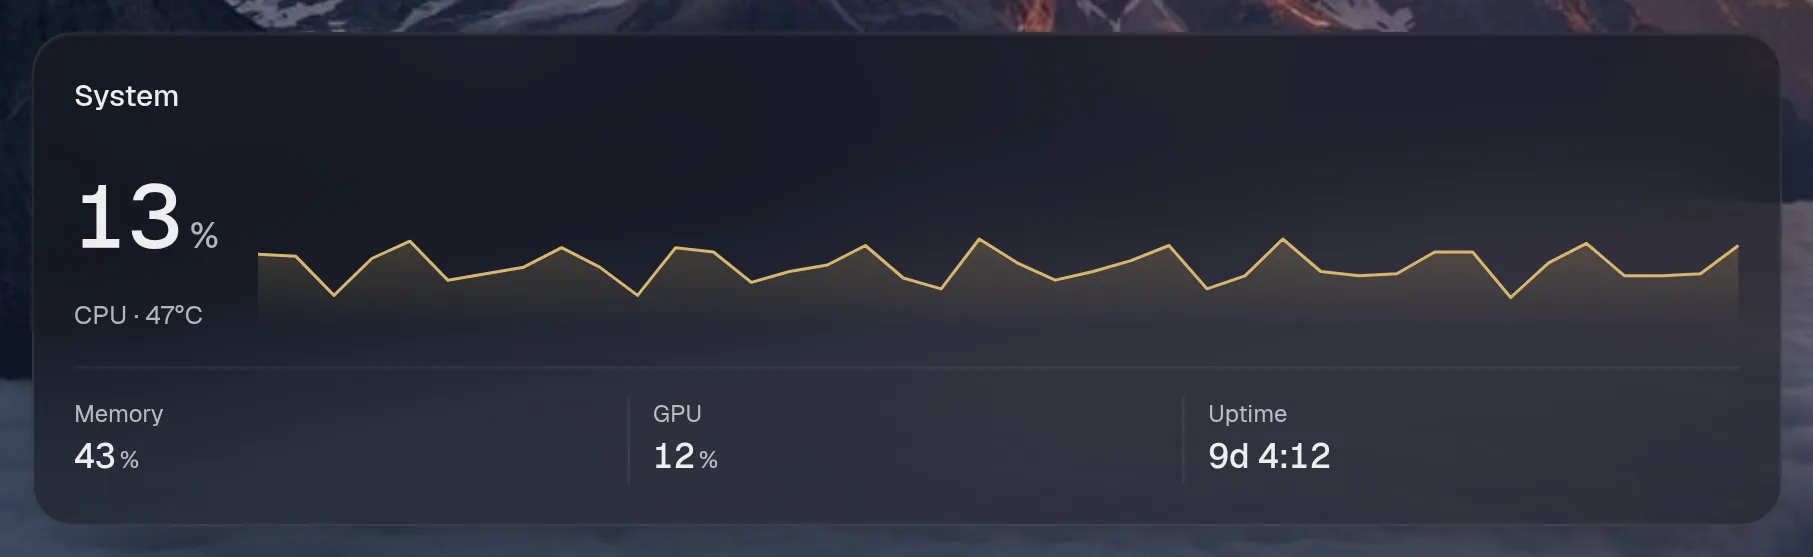
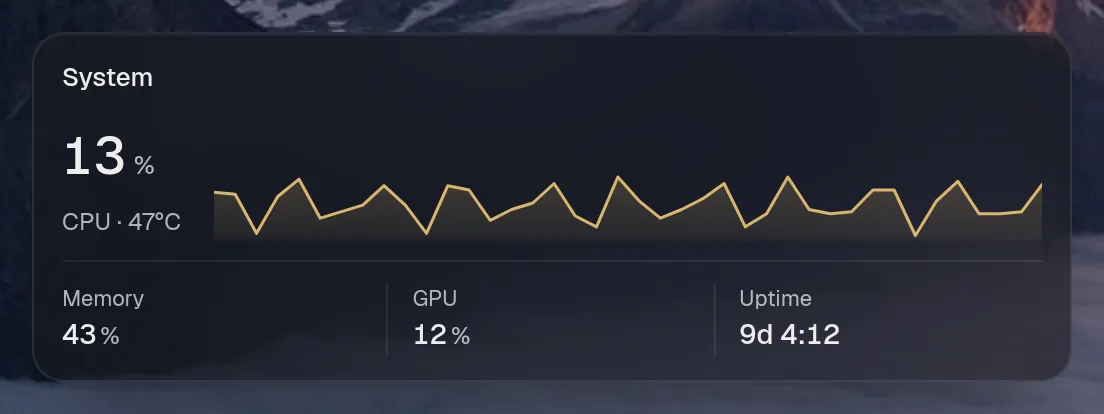
Tall draws the same as medium, so it isn't shown. Only the empty space changes.
States
Section titled “States”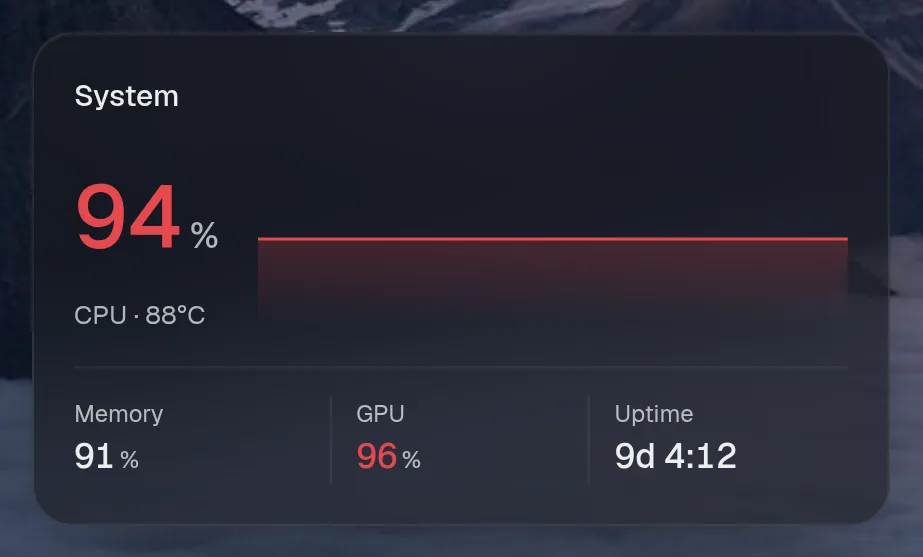
Storage
Section titled “Storage”glances.disks · list card · refreshes every minute while the page is open.
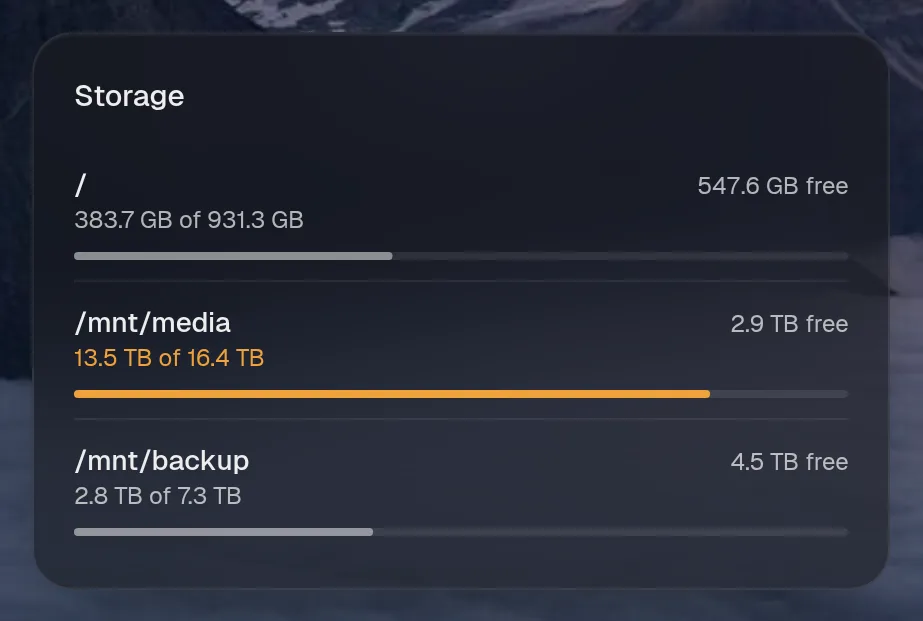
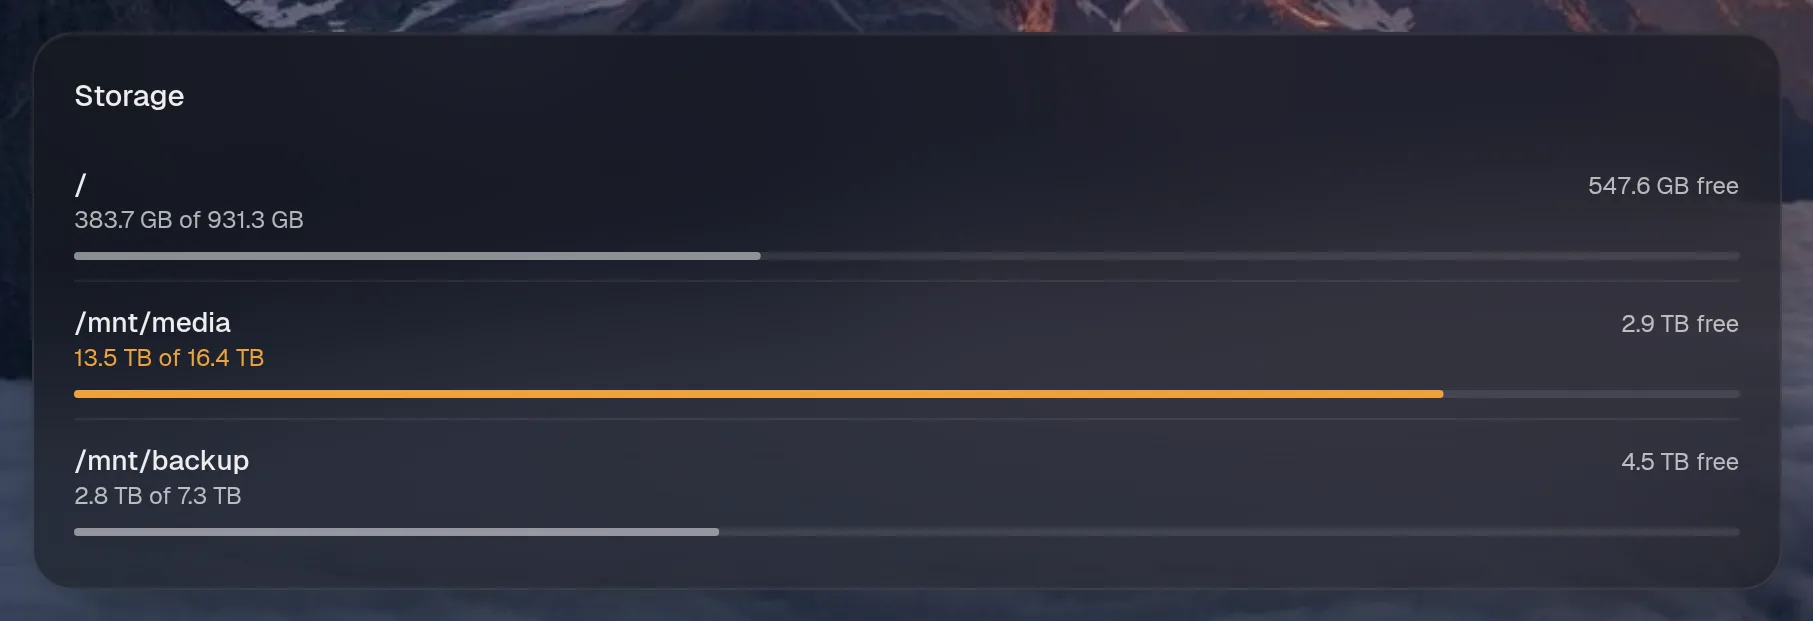
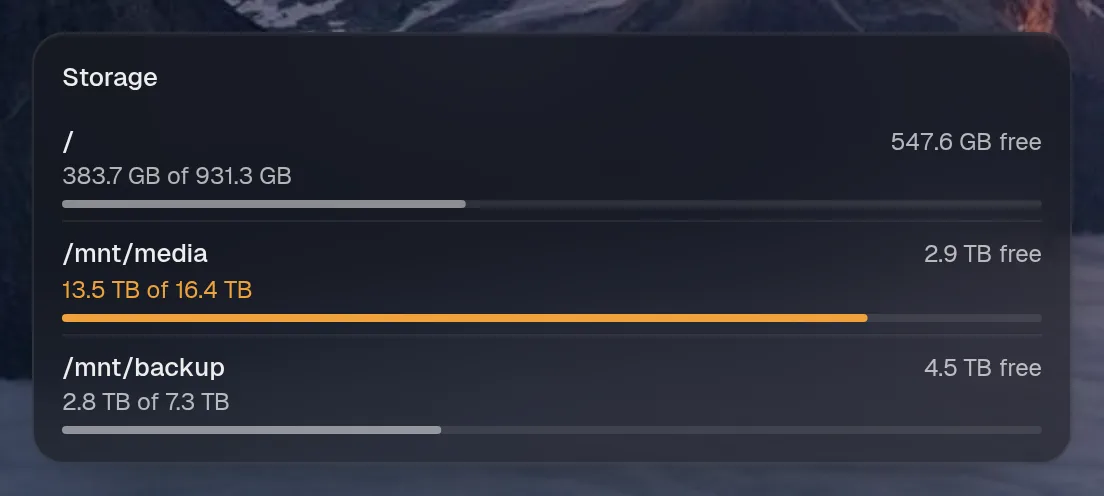
Small draws the same as medium. Wide draws the same as medium. Tall draws the same as medium, so they aren't shown. Only the empty space changes.
States
Section titled “States”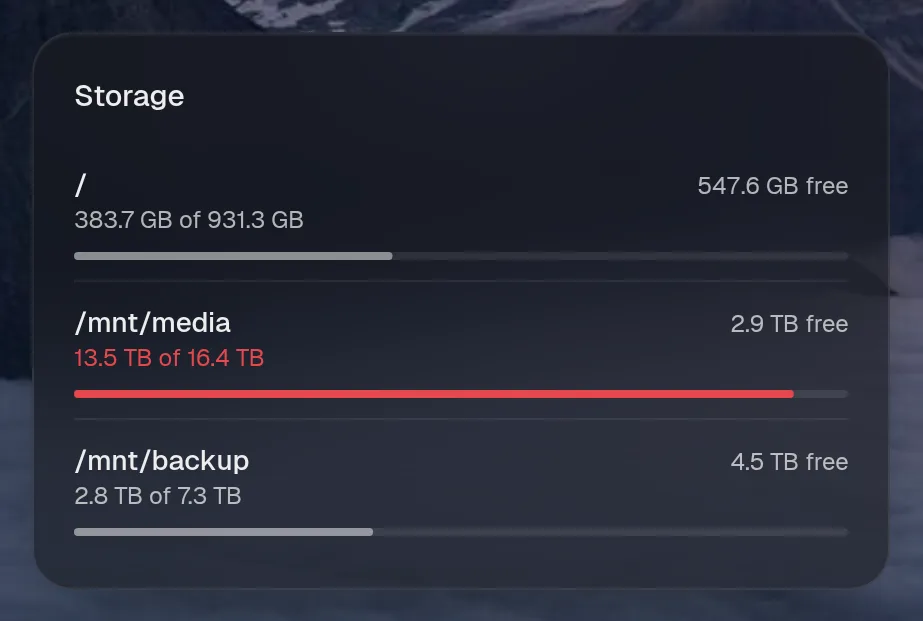
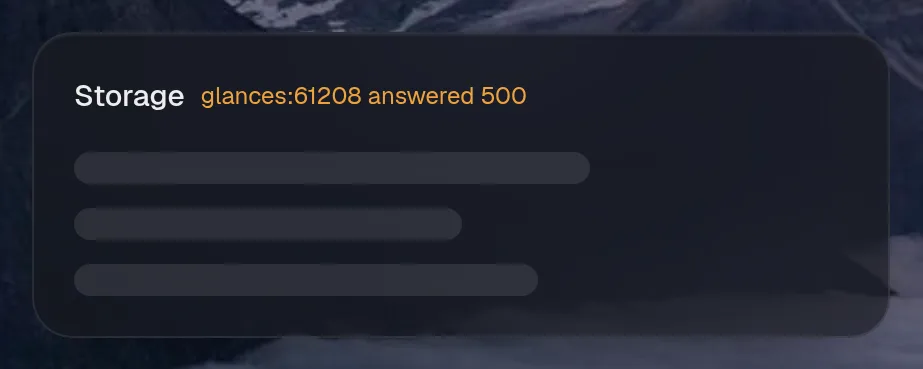
Assistant tools
Section titled “Assistant tools”What the assistant can use, once its access level allows it. Read tools run freely. Everything else asks first.
| Tool | Access | What it does |
|---|---|---|
top_programs | read | What is using the server right now: the programs using the most CPU or memory (grouped by program name). |
system_status | read | Current CPU, memory, CPU/GPU temperatures, GPU load and uptime of the server, plus disk usage. |